Mapping Human Exposure to Ticks
 Human exposure (E) to ticks
The third paper associated with this research was published in Scientific Reports in 2018. Let’s first recap the two previous publications. In the first one we learnt that the volunteered tick bites collection represents the risk (R) of getting a tick bite. In the second paper, I explained how to obtain daily tick activity, which is a proxy of the tick hazard (H) of a location. However, there is a third component in the equation: human exposure.
Human exposure (E) to ticks is a tricky component to quantify, because we know that ticks are patiently sitting in forests, grasslands or urban green spaces, but it is much more complicated to know where and when we humans go in our leisure time. ICT companies (can) know the location of our phones at any time, and social media content might provide a rough idea on where and when people are located. However, privacy laws or the costs of acquiring social media data implied that these were not possibilities for us: we needed to be creative and witty at mapping where people are exposed to ticks only relying in our own data collection.
And eventually we came up with an beautifully simple idea on how to create a map showing where citizens are exposed to ticks. Remember we were using this framework from risk assessment: R = H * E, which implied that E = R / H. We used probabilities to illustrate that this relationship is plausible, which means, in more general terms, that the division of a risk component by a hazard component gives an estimation of the human exposure to a phenomenon. This conceptually simple idea is very powerful, since it can be applied across fields, and it does not involved complicated models hampering the interpretation of the results.
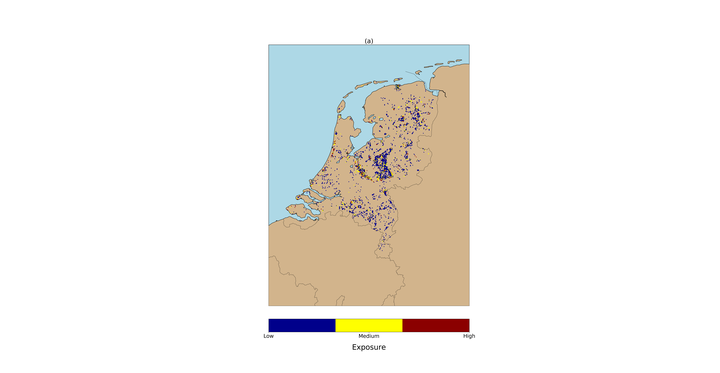
The validation of results required again some creativity, since we did not have any reference from other studies layer showing human exposure maps. Since the E layer shows locations with outdoors human exposure, we compared it with a publicly available layer of the attractiveness of the landscape. With this comparison we found out results that made sense: less attractive forest patches, mostly at the outskirts of cities, present similar levels of human exposure, whereas more attractive forests show a more intense exposure.
Now that we know the important role of human exposure, we can devise a tick bite risk model that tries to characterize human exposure as better as we can.
The main conclusions of this study are…
- … clusters of high human exposure are located along forest edges and popular places for recreation
- … human exposure is mainly driven by two types of activities: recreational and residential, and these might require different campaigns
- … risk is driven by human exposure more than the hazard existing in a place
- … human exposure map can help at knowing what forest require attention more urgently due to the high amount of visitors.
Irene Garcia-Marti
PhD Data Scientist
I have a keen interest in applying machine learning methods in the field of spatio-temporal analytics.