Modelling Daily Tick Activity
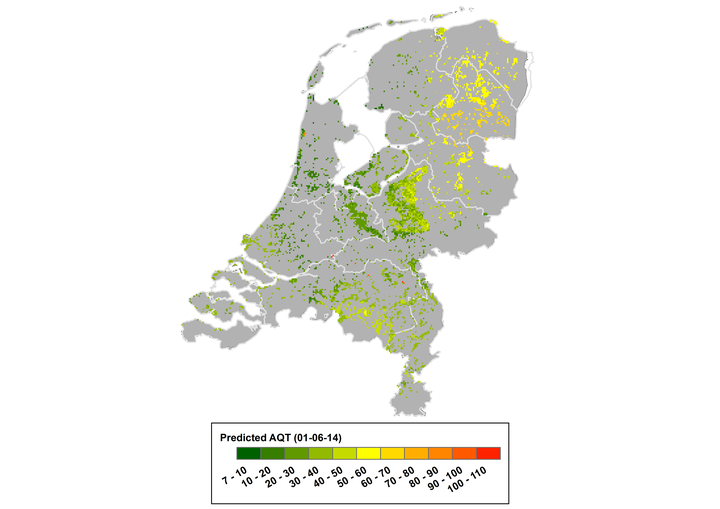
 Tick activity for June 1st, 2014
The second paper of my research was published in 2017 in the International Journal of Health Geographics. In this article we explain what is our approach to model tick activity, a proxy for tick hazard (H). Tick activity is a sneaky phenomenon to model, because it is the product of several simultaneous natural phenomena such as weather, vegetation changes, or wildlife dynamics (not available in this research). These factors are intertwined with each other and they determine tick survival, by creating (un)favorable conditions for ticks to thrive/die throughout the year. Today we have ground stations monitoring weather, satellites looking at our planet, organizations that report about nature and wildlife; but how do we know about the activity of something this small?
In 2006 a group of trained volunteers coordinated by researchers of Wageningen University, started to monitor tick activity on a monthly basis in 15 forested locations in the Netherlands. Tick activity is often sampled using a method called dragging, which basically consists in pulling a cloth attached to a rod along vegetation transects. Every few meters, the volunteer stops to count the tick specimens catched in their different life stages (larvae, nymph, adult), and continues until the end of the delimited transect. This remarkable effort was carried out once a month for ten years, only occasionally interrupted by really harsh winter conditions. Thanks to the long-term engagement in the project and the determination of these volunteers, today we have one of the longest records of tick activity for research. This is really exceptional and I feel privileged at being able to continue the work of these volunteers.
The difference between tick activity and other tick hazard proxies, such as presence, abundance, or habitat suitability, is that the activity presents a seasonal behavior: as long as the year advances, the volunteers sample higher and higher tick activities that peak in early-to-mid-summer, and then decrease towards the winter. These dynamics, which are (very) different in the 15 monitored sites (check article!), are the ones that the models need to learn, so we can predict tick activity in unseen locations. As said before, tick activity depends on weather and vegetation factors. We prepared an array of features that we think can help at characterizing each observation taken by each volunteer in each sampling site. However, the tick activity that the volunteers sample today, are a product of the past environmental conditions. For example, if the past month was very dry, the expected tick activity today might be low. Thus, we prepared an array of 101 features that include conditions of the days prior to the sampling.
The modelling of the enriched volunteered tick activity collection was done using a well-known ensemble learning method: Random Forest. This method is useful when the data collection to model contains a high degree of non-linearity but not so many samples in it. There are countless examples in literature lauding at the properties of this method, but there is one thing (at least) that Random Forest can’t do: handling the temporal dimension out of the box. In this article, we propose a data-level modification of this method that enables it to correctly predict tick activity levels that conform the expected values for a month.
The locations where the volunteers monitor the tick activity are mainly forested locations with thick shrub vegetation. Thus, our model will learn to predict tick activity in this type of environment. After training the model and validating it with statistical metrics, we applied it to all forested locations in the Netherlands, roughly 3,500 sq.km. Remember that this model has been trained to handle the temporal dimension, so we can apply it to the time window of our choice. We selected a daily time window, hence, for each day within the period 2006-2014, we applied the model getting daily maps of tick activity as the image above shows.
The main conclusions of this study are that…:
- …atmospheric water levels (evapotranspiration, relative humidity) are the most important variables determining tick activity.
- …these variables, combined with temperature, are the most important across time scales
- …the sustained effort of the volunteers was enough to predict daily tick activity at the country level.