Extract rainfall data from radar files in stereographic projection given lat/lon coordinates
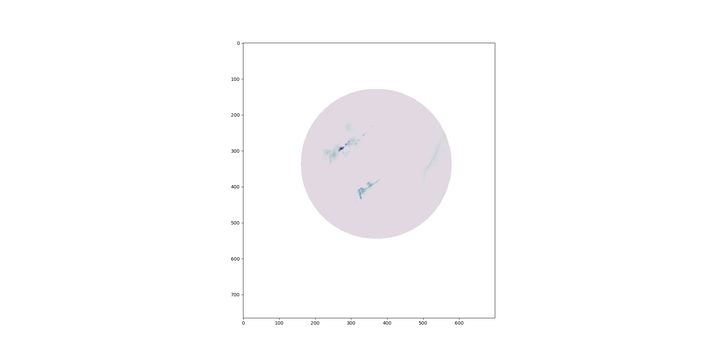 5-min interval of rainfall over the Netherlands as seen in a stereographic projection.
When you are a kid you often stumble upon these stories of pirates seeking a hidden chest in a remote island. The pirates embark on an adventure full of perils to find the treasure using the coordinates of a worn map. I always found fascinating how these numbers, degrees, minutes and seconds, could pinpoint a location on Earth’s crust and provide the pirates with a valuable bounty. Reality is a bit more prosaic and over time, geographers have sophisticated the way we represent geographic information. It’s common to understand pairs of coordinates, now in decimal degrees, not in the “pirate” notation, but the underlying concept is the same.
In my job, I usually handle coordinates in decimal degrees, boringly referred to as EPSG:4326.
However, this is not the only way to represent geographic information, since there are plenty,
literally a legion, of coordinate reference systems to refer to a place. Google Maps use WGS84/Web Mercator (EPSG:3857) and weather models use Lambert Conformal Conical, to name a few examples.
Rainfall is often monitored using radar antennas which keep spinning throughout the day, scanning our sky in the search of precipitable water. The map you got as a result is a sphere, which is usually represented in the so-called “stereographic” projection to make it 2D. The concept is still the same: you need a pair of numbers to pinpoint your location, but these numbers are a bit rough, since they have nothing to do to the decimal degrees you know from different web mapping services. Yet, they represent the same location.
I had a set of coordinates in EPSG:4326, that is, lat/lon, and I needed to extract the values of rainfall from a radar raster file, which uses a stereographic projection. In principle, a transformation of coordinates should suffice, but what happens if you only have access to the raster values in a 2D array? That means: no direct information about the latitudes and longitudes stored in the file. In other words: once you have made the transformation, how do you know which grid cell to access? This little tutorial tries to illustrate this process for a use case using KNMI’s rainfall radar files.
First you need to know about the bounding box of the radar files and the number of rows
and columns that these files is using. In this use case, you can check the [product description]
(http://adaguc.knmi.nl/contents/datasets/productdescriptions/W_ADAGUC_Product_description_RADNL_OPER_R___25PCPRR_L3.html)
of the KNMI Precipitation Radar. Section 1.4.1 provides the product corners and Section 3.4
provides the raster object information.
llcrnrlon = 0
llcrnrlat = 49.36206
urcrnrlon = 10.856429
urcrnrlat = 55.388973
width = 700
height = 765
Next thing needed is the proj4 string of the source CRS and the target CRS. You can check
the target stereographic projection string in Section 4.1.5 and check epsg.io/4326
to get the same string for WGS84. Note that the ellipsoid axes in the product description are
in kilometers, but it appears pyproj requires these in meters.
proj_wgs84 = pyproj.Proj("+proj=longlat +datum=WGS84 +no_defs")
proj_stereo_rad_nl = pyproj.Proj("+proj=stere +lat_0=90 +lon_0=0 +lat_ts=60 +a=6378140 +b=6356750 +x_0=0 y_0=0")
After this process, we need to define a transformation between these two systems. Something
that tells Python how they are related. We do so using the Transformer class from the pyproj
library. Check the documentation
to better understand the parameters of the .from_proj() method.
transproj_eq = Transformer.from_proj(proj_wgs84, proj_stereo_rad_nl,
                        always_xy=True, skip_equivalent=True)
Once it is defined, we apply this transformation to, both, the set of coordinates of interest, and the corners of your bounding box:
# Transforming the original points to stereo
original_points = list(zip(lonlist, latlist))
i = 1
transproj_eq = Transformer.from_proj(proj_wgs84, proj_stereo_rad_nl,
                        always_xy=True, skip_equivalent=True)
llonsstereo, llatsstereo = [[] for i in range(2)]
print("\nReprojecting #1: WGS84 locations to stereographic")
for pt in transproj_eq.itransform(original_points):
    lon_stereo = pt[0]
    lat_stereo = pt[1]
    llonsstereo.append(lon_stereo)
    llatsstereo.append(lat_stereo)
    print("\t {0}): {1}, {2} ".format(i, lon_stereo, lat_stereo))
    i += 1


# Transforming the corners of the bounding box to stereographic
lons_bbox = np.array([llcrnrlon, urcrnrlon])
lats_bbox = np.array([llcrnrlat, urcrnrlat])
corners_bbox = list(zip(lons_bbox, lats_bbox))

i = 0
print("\nReprojecting #2: WGS84 NL BBOX corners to stereographic)")
lats_bbox_stereo, lons_bbox_stereo = [[] for i in range(2)]
for pt in transproj_eq.itransform(corners_bbox):
    lon_stereo = pt[0]
    lat_stereo = pt[1]
    lons_bbox_stereo.append(lon_stereo)
    lats_bbox_stereo.append(lat_stereo)
    print("\t {0}): {1}, {2} ".format(i, lon_stereo, lat_stereo))
    i += 1
Okay, now we got all coordinates transformed. This means that we know their exact position
in the target stereographic grid. But still, our rainfall radar raster file is a matrix of (765, 700)
rows and columns. We need to split the obtained extent or bounding box in stereographic into a
matrix of these dimensions. We use numpy as follows to obtain such grid:
xs = np.linspace(lons_bbox_stereo[0], lons_bbox_stereo[1], width)
ys = np.linspace(lats_bbox_stereo[0], lats_bbox_stereo[1], height)
x2d, y2d = np.meshgrid(xs, ys)
The objects x2d and y2d are 2D arrays containing in each cell position the maximum
“latitude” and “longitude” that can be represented in that pixel. This is interesting,
because then you can ask these arrays where the stereographic coordinates of your original
points of interest start exceeding their value, thus implying your locations are
sitting in that pixel. For example, for a location sitting in X=362 and Y=350, that is,
the middle of your raster, all pixels beyond X>362 and Y>351 will match this condition.
Hence, we select the minimum, the first, of all these positions, because this is where
the location first exceeded the threshold.
i = 1
lpos_xy = []
transformed_points = list(zip(llonsstereo, llatsstereo))
print("\nFinding position of stereo point in the radar grid")
for pt in transformed_points:
    pos = np.where((x2d > pt[0]) & (y2d > pt[1]))
    pos_x = np.amin(pos[0])
    pos_y = np.amin(pos[1])
    lpos_xy.append([pos_x, pos_y])
    print("\t {0}): {1}, {2} ".format(i, pos_x, pos_y))
    i+= 1
Once we find out the grid positions, we just fetch the values in the raster and we can continue with the analysis.
You can find the full code snippet here.
You can copy and paste it in your Python IDE and it should work, just make sure you
have the required libraries installed. Note there might be better ways of doing
this operation, I am just sharing the option that worked for me. If you have
comments on the code, please leave them in the snippet page
in gitlab, so we all can continue learning!
Irene Garcia-Marti
PhD Data Scientist
I have a keen interest in applying machine learning methods in the field of spatio-temporal analytics.