Developing a Drought Monitor Prototype for the Netherlands
 Drought Monitor
The Netherlands is a country in a constant battle with increasing water levels, especially since the 14th century. Canals, dykes, and polders are part of the landscape and intrinsically rooted in the Dutch culture. You would expect that rainfall is ensured in this northern European country, that is why everything is so green and shiny, right? Well, this might (gradually) not be the case anymore, because climate change seems to have altered the regional precipitation patterns that have showered this country for centuries. As a consequence, in the last decade the Netherlands has experienced the first severe droughts, triggering several negative impacts for different socio-economic sectors and subsequently speeding up the research and policy agendas for drought mitigation.
Drought is not an absolute term, in the sense that you can measure meteorological, agricultural, or hydrological droughts that may (or may not) occur simultaneously over a region. Meteorological drought is the deficiency of precipitation over a long period of time, agricultural drought refers to the decrease of soil moisture for crop production, whereas hydrological drought is associated to the depletion of surface and subsurface water supplies (lakes, aquifers). Monitoring drought is a challenging task, since it requires complex equipment with nationwide coverage, such as ground observation stations, remote sensing imagery, even computer simulations, to estimate the available water. In the case of meteorological drought, rainfall is monitored by a network of rain gauges (300+ in the Netherlands) and using weather surveillance radars. This means that every few minutes it is possible to know the locations where it is raining, but note that here we would like to know about the contrary phenomenon: absence of water.
Last June I had the opportunity of participating in a two-week sprint at KNMI to build up from scratch a prototype of a Drought Monitor using the Standard Precipitation Index (SPI) as the main indicator characterizing meteorological drought. The SPI was developed in the early 90s (McKee et al., 1993), and intended to unify the different drought indicators back then under a single variable. The SPI is convenient because only uses a single variable to compute drought: precipitation accumulation. Currently, there are improvements of this index, such as the SPEI, which also includes evapotranspiration in the modelling. However, actual evapotranspiration is tricky to compute (flux towers are required), and we were aiming for a prototype with a fair spatial coverage that we could finish in two weeks time.
We formed a (great!) team of colleagues (researchers, developers, data scientists) to create from scratch this drought monitor prototype, keeping these three main goals in mind:
Create an indicator that can be reused as part of a forthcoming Early Warning System. This requires the prototype to be “alive” by showing new data every day.
Create an exploratory tool showing maps and charts depicting the daily values of SPI at 1km of spatial resolution, enabling the fast assessment of worrisome drought conditions in the country. Note that it is not public yet.
Couple this drought monitor with the 15-day forecast of ECMWF so we are able to predict, based on this forecast, the expected drought conditions throughout the country. In this way, we enable short-term decision making.
Without further ado, take a look to our prototype:

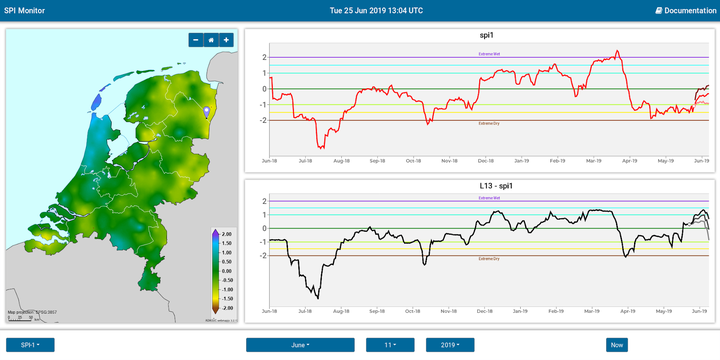
The map shows the SPI for June 11, 2019, in which you can see that there were dry conditions in the northeast and wet conditions along the coast. Next to the map, we added two plots showing the evolution of SPI since June 11, 2018. Note that these two plots come from two different experiments. The one above corresponds to our prototype and shows the SPI in each selected location, whereas the plot below is the previous work of other colleagues and shows the mean SPI for the country. The difference between the two experiments is the number of rain gauges used for the modelling and the length of the time-series: we used 300+ rain gauges providing data since 1951, whereas our colleagues used 13 rain gauges starting in 1910. We added this information to enable the comparison between the two approaches.
Taking a closer look to the plots, you can see that at the end of the SPI curve, the time-series is split in three lines. A nice feature that we have added to this application is that we take the 15-day forecast provided by ECMWF and we apply the SPI model to the forecast to obtain a short-term prediction of the drought conditions. These three lines represent the 10, 50, and 90 percentiles of the forecast drought, indicating the most likely fluctuations of the SPI in the next 15 days.
You might wonder why a drought monitor is important. Decision makers who are aware on the drought levels at the national scale can promote actions to mitigate its damaging effects. For example, drought is related with the capacity of ensuring water supply to citizens, the salinization of the ecosystems, soil erosion, and naturally, affects crop production. Thus, a drought monitor could help at better planning water management, ecological or agricultural practices.
If you want to know more about the technical part (data analysis, technologies used), you can continue your reading in the second part of this post.
Irene Garcia-Marti
PhD Data Scientist
I have a keen interest in applying machine learning methods in the field of spatio-temporal analytics.