Assessing the quality of volunteered weather observations
 Hourly temperature interpolation for the province of Utrecht using volunteered weather observations
Weather observations are typically collected by professional devices siting in open spaces. These weather stations provide very precise measurements, but they also require a regular maintenance and calibration of the sensors, which implies a high cost for national weather services. In general terms, one could say that we are good with the current weather forecast. In the end, the combination of in-situ measurements with numerical weather models and remote sensing data, provides a decent weather forecast for several days in advance. This forecast is capable of showing the general dynamics of the atmosphere (pssst, weather scientists call this the ‘boundary layer'), so we can predict what the weather will be like in the near future.
However, one of the limitations of these official weather monitoring networks is that the stations are sparsely located across the geographic space. This might be less of a problem for well-behaved variables, such as temperature, air pressure or relative humidity, which tend to vary gradually and smoothly with distance. But for rainfall or wind, the measurements taken by the stations might not be representative enough of the surrounding area. In addition, we humans have heavily modified the landscape (urbanisation, deforestation) in the past decades, and this in turn, has created new local weather effects such as urban heat islands. Both situations, spatial sparsity and new local effects, pose challenges to advance towards a higher-resolution weather forecast.
Quality control of citizen weather stations
In the past ten years there have been a number of private and public initiatives to collect weather data from citizen weather stations (CWS). These initiatives bring together a community of citizens that have in common an enthusiasm for weather monitoring. Most of the volunteers are individual citizens that have installed a weather station in their garden, although there are other organizations, like schools or research institutes, that also contribute at monitoring the weather by installing a weather station on the premises. These observations are usually stored in a central repository, where other users can visualize and/or download the data.
One of these initiatives is Weather Observations Website (WOW), an initiative launched by the UK Met Office in 2011 that currently aggregates 1,400 millions of observations collected by nearly 17K stations worldwide. It’s a lot of data! In 2015, the KNMI joined this initiative as a partner, so citizen weather observations collected in Dutch territory are also uploaded to this repository. Currently, over 400 CWS contribute observations to WOW. I do not have the exact figures for the Netherlands in particular, but we know that for the NL/BE region around 3.5 million observations per month are stored in WOW repositories.
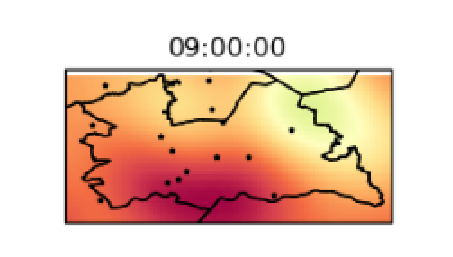
Earlier this year I had the opportunity to start working at assessing the quality of the air temperature observations collected by the WOW-NL network. We selected the province of Utrecht as study area, and we downloaded and processed 11.6 million observations for the period 2016-2018. We realized that most of the stations provide observations at the intra-hour temporal resolution, so we thought that we could 1) assess the quality of the observations and then 2) create interpolated layers of air temperature each hour. We applied the quality control schema described (Napoly et al., 2018), and then we used Ordinary Kriging to get a basic interpolated layer with a well-known algorithm that we could use as a baseline. Our results (see slides) show that, according to this quality schema, around 60% of the volunteered observations are good, and there are still enough observations per hour to create interpolated layers of temperature, as you can see in the featured image.
Why are we doing this?
The quality assessment of CWS data is an important step in weather and climate services, because if we deem these observations as ‘good enough’, this might in turn open the door for new research. This novel source of data might be important at reaching high-resolution weather forecast and/or nowcasting. Citizen weather data could contribute to create finer-grained gridded weather variables, and the density of the volunteered monitoring network could help at understanding local phenomena, such as urban heat islands or wind dynamics in cities.
At the governance level, opening the door to CWS monitoring, especially in cities and peri-urban areas, could save some resources to the administration, since the maintenance costs would be very reduced. Volunteers and weather enthusiasts would take care of keeping the CWS up and running, and simultaneously, they would be contributing at monitoring underrepresented areas or urban areas. Last but not least, my favorite reason to work at assessing the quality of citizen weather data is that the lessons that we learn today, could be reused in the future in developing regions around the world, where the infrastructure for weather monitoring might not have a sufficient coverage.
Follow-up
A follow-up of this work will be presented in the AGU Fall Meeting 2019. If you are around and interested, please come to this session and let’s have a chat!
Irene Garcia-Marti
PhD Data Scientist
I have a keen interest in applying machine learning methods in the field of spatio-temporal analytics.